
This article is a straightforward comparison of how various European countries perform on a variety of metrics. For a fair comparison with the UK, non-western countries, and micro-states have been omitted. The comparisons will include any or all of the following 15 countries: Austria, Belgium, Denmark, Finland, France, Germany, Ireland, Italy, Luxembourg, Netherlands, Norway, Portugal, Spain, Sweden and Switzerland. If a country does not compare in a given list, the most likely reason is the difficulty of obtaining accurate data, not a deliberate omission to skew the picture.
Firstly, some good news when we compare healthcare systems. This chart isn’t a comparison of western Europe, but gives a pretty clear picture anyway.

As you can see, the NHS is rightly something of which all Brits can be proud.
Next, incarceration rates

Source: http://www.prisonstudies.org/world-prison-brief
The above map shows the number of prisoners per 100,000 citizens. In the map, Scotland, N Ireland and England & Wales are three separate numbers, with England & Wales and Scotland being the highest two rates in western Europe. Interesting to note is the lower rate for N Ireland.
Next GDP per capita

Source: IMF, 2014
The chart above shows GDP per capita, and the UK is the fourth lowest of the 16, only above Spain, Portugal and Italy.
Next a chart showing cost of living.
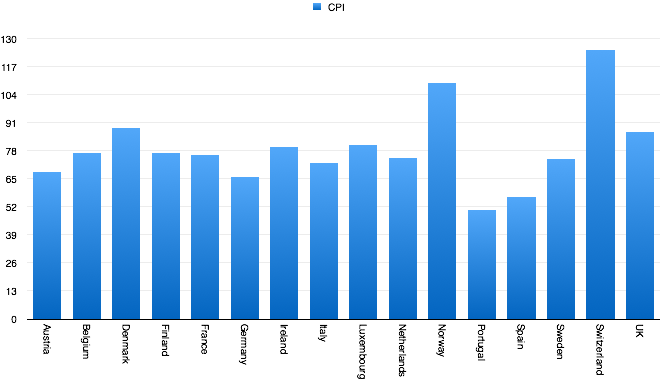
Source: http://www.numbeo.com/cost-of-living/rankings_by_country.jsp
The Consumer Price Index shows the cost of living as compared to the cost of living in New York City, which has the score of 100. Here, the UK has the fourth highest cost of living of the 16, only behind Switzerland, Norway and Denmark.
Next, rail prices
- UK – £3,268
- France – £ 924
- Germany – £ 705
- Spain – £ 653
- Italy – £ 336
The above list shows the price a commuter would pay annually if they were to live 23 miles away from the capital city of each of the five major western European countries. In this metric, more than any other, the UK really shows significant problems.
Next, average rent

Source: https://www.housing.org.uk/media/blog/private-renters-in-uk-pay-double-the-european-average/
While not quite as extreme as the rail difference, Brits also have to pay, by some margin, the most expensive rents per month in western Europe. At €902, it is a significant amount more than the next most expensive, Ireland, at €679.
Next, the GINI coefficient

Source: http://ec.europa.eu/eurostat/tgm/table.do?tab=table&language=en&pcode=tessi190, 2013 figures
The GINI coefficient is a measure of how unequal a country is in terms of wealth, where a lower number means more equality. Here, the UK is the fourth highest, behind Italy, Spain and Portugal
Next, a look at the average income of the bottom 20%
- Germany – £7,918
- France – £7,486
- Belgium – £7,308
- Denmark – £7,209
- Netherlands – £6,671
- UK – £5,639
Source: http://www.michaelmeacher.info/weblog/2014/06/the-poor-in-britain-are-among-worst-off-in-western-europe/
As you can see, our bottom 20% receive noticeably less than their counterparts in mainland Europe. This difference is even more stark when the cost of living is accounted for.
Moving off money, we shall now look at teenage pregnancies.
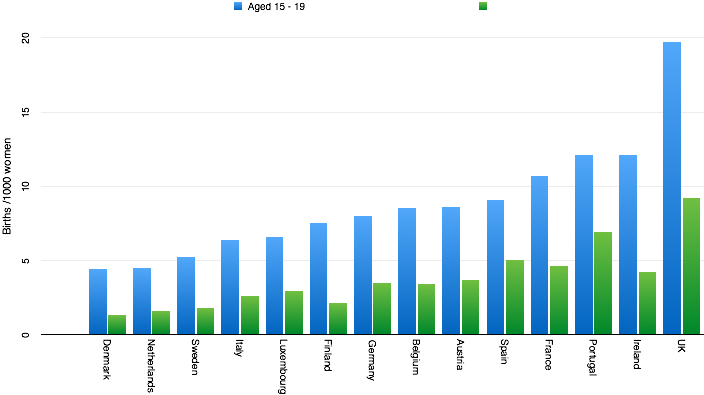
Source: http://www.ons.gov.uk/ons/rel/vsob1/births-by-area-of-usual-residence-of-mother–england-and-wales/2012/sty-international-comparisons-of-teenage-pregnancy.html
As the above chart shows, Britain leads in western Europe by some margin on teenage pregnancies, both in 15 – 17 and 15 – 19 rates.
Finally, slightly better news in education.
| Country |
Maths |
Reading |
Science |
| PISA 2012 Average |
494 |
496 |
501 |
| Austria |
506 |
490 |
506 |
| Belgium |
515 |
509 |
505 |
| Denmark |
500 |
496 |
498 |
| Finland |
519 |
524 |
545 |
| France |
495 |
505 |
499 |
| Germany |
514 |
508 |
524 |
| Ireland |
501 |
523 |
522 |
| Italy |
485 |
490 |
494 |
| Luxembourg |
490 |
488 |
491 |
| Netherlands |
523 |
511 |
522 |
| Norway |
489 |
504 |
495 |
| Portugal |
487 |
488 |
489 |
| Spain |
484 |
488 |
496 |
| Sweden |
478 |
483 |
485 |
| Switzerland |
531 |
509 |
515 |
| UK |
494 |
499 |
514 |
Source: http://www.oecd.org/pisa/keyfindings/pisa-2012-results-overview.pdf
PISA is an organisation that measures 15 year olds in 65 developed countries on math, reading and science. Although we do not perform overly well compared to western Europe as a whole, this is one of the few areas where the UK performs better than Scandinavia.
Overall, when looking at the ten areas above, is it quite clear that the UK has a lot of work to do, other than in healthcare. The UK, with its large wealth gap, poor pay for the bottom 20%, high rents and high railway cost, is becoming a particularly difficult country to live in if you do not make a high wage.

I’d like to see figures for average rents and cost of living excluding the capital city, as I feel the ‘London effect’ might be more pronounced than that in other european capital cities, and so might be skewing our numbers, but thank you for putting all this together. It’s much appreciated.
LikeLike